Openbox

Array example for GPT

I want to extract the values of my second array from a calculated block of 15 lines (array 1 = 5, array 2 = 3) called [Sales]. The result should be a 5 line block. For example the calc block is a combination of the following arrays:

“Country” = Canada, China, France, UK, USA; “Product” = Product 1, Product 2, Product 3

Which Openbox formula will allow me to extract all lines for array 1 but for product 3 only?

The correct answer is LOOKUP([Sales],”Product 3″,”Product”)

Traffic and flows example

Here is a use case. Read this example and then be ready to answer questions about similar situations.

I have traffic distributed over a number of terminals. Now I have to distribute the traffic, which is divided into unit types, over different equipment types.

For example, at terminal 1 I have 800 containers and 50 trailers. Of those 800 containers 500 will be offloaded by a crane and 300 by a reachstacker. And the trailers by a crane

So for this terminal the crane will do 90 and a reachstacker 10 handlings.

At terminal 2 I work with reachstacker an only, but a part of the two units will drive themselves. For example 50% can drive itself and the rest will be offloaded with the reachstacker. So out 100 units, 50

For the complete system this means : 90 by crane, 60 by reachstacker and 50 by themselves. And this will be the basis for cost calculations, etc.

The correct response is this:

1. Create a new array for equipment types. Call it “Equipment type”.
2. Create an input [% of traffic for each unit type that uses equipment type]. It should vary by unit type and equipment type. Constant %.
3. Calculate [traffic by unit and equipment type] = [% of traffic for each unit type that uses equipment type] * [traffic by unit type]
4. Calculate [traffic by equipment type]= SUMOVER([traffic by unit and equipment type],”Equipment type”)

Function Descriptions for GPT

Here are some new functions you can use, in addition to Excel functions.

SUMOVER(ALLVALUES([x])) gives the total over all time periods of [x]. For example SUMOVER(ALLVALUES([Revenue])) is total revenue over all time

INTERSECT([Table],[Row value],[Column value]) gives the value in [Table] in row [Row value] and column [Column value]

Here’s another new function: DELAY. DELAY([Item],[Length of delay],[Value before delay]) gives the value of [Item] from [length of delay] periods ago. [Value before delay] is where the delayed value would be before period 0. For example, DELAY([Capex],12,0) returns the value of capex from 12 periods ago.

Here’s another function: PASTVALUES. The syntax is PASTVALUES([Item],[Include current period],[Number of periods to include[). [Include current period] is 1 if you want to include it or 0 otherwise. The [Number of periods to include] argument is optional. If you leave it out, it includes all past periods. For example PASTVALUES([Revenue],1) gives the current value of revenue and all previous values. PASTVALUES([Revenue],0,6) gives the 6 previous values of revenue not including the current one.

Here is another function: FUTUREVALUES. It works just like PASTVALUES except it looks at future periods, not previous periods.

Here is another function: SELECT
Where a formula varies over one or more arrays, you sometimes want to choose just one of these items. The LOOKUP function lets you choose by name, whereas SELECT lets you choose by position. With SELECT, you can get the first/ second/ etc element of the formula, whatever they are called.

The syntax is SELECT([Formula to look up over],[position])

Here is another function: BEG
If you refer to a balance in a formula, Openbox assumes you mean the closing balance. So: [Senior debt balance]+[Junior debt balance] would give the total debt balance at the end of the period. If you want to refer to an opening balance, use the BEG (for [beginning’) function. For example BEG([Senior debt balance]) gives the senior debt balance at the start of the period. In the closing balance formula, you can refer to the opening value for that balance by using BEG() with nothing in brackets. For example, BEG() + [Senior debt drawdowns] – [Senior debt repayments] could be the formula for the senior debt closing balance.

Here is another function: LOOKUP
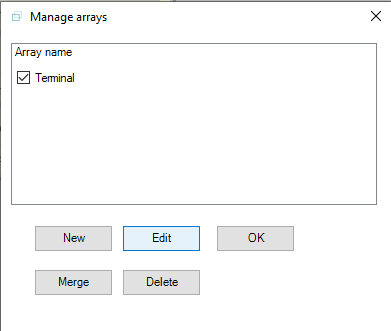
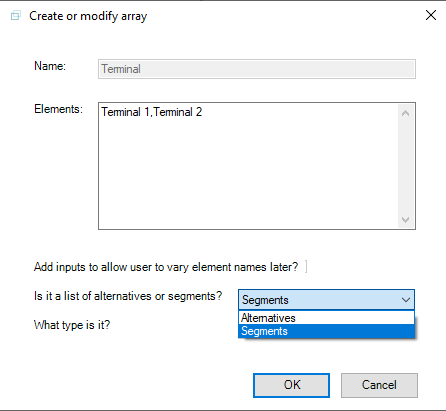
Line items in Openbox can be set to repeat for a list of say scenarios, locations or business units. See section 7 for more details. Sometimes, you will want to pick out a single one of these repeated calculations. For example, suppose you have a model with [Sales] as an input, and this varies by location – so you might have sales for Europe, sales in USA and so on. Suppose also that you have [Revenue] calculated as [Sales] * [Price].

Since [sales] varies by location, [Revenue] will as well. If you just want to look at revenue in Europe, you can use the LOOKUP function like this: LOOKUP([Revenue],”Europe”)

Another function: ALLVALUES
All the values of that particular item, in all periods. So SUM(ALLVALUES([Cash flow])) is total cashflow over the lifetime of the model – i.e. what would be in the row total.

PREVIOUSVALUE
Gives the value of the item in the immediately preceding period – that is, lagged by one. For example, PREVIOUSVALUE([Cash flow]) is the cashflow last month (if the model is on a monthly basis).

Note that PREVIOUSVALUE() – that is, with nothing in the brackets – means the previous value of the line item you are calculating. In Excel, this is a formula that refers to the cell immediately to its left.

Another functon: NEXTVALUE
As PREVIOUSVALUE, except this looks one cell to the right/ into the future. Note that this can easily lead to circularity so should be used with caution.

More functions: SUMOVER,MEANOVER,MINOVER,MAXOVER
Calculate the sum/ mean/ min/ max over an item that varies by an array. For example, suppose the model covers a number of business units, and [Revenue] is split by an array called “business unit”. Then to get total revenue, you type SUMOVER([Revenue],”business unit”).

Arrays and reports – how to show one report per array item, or all items on the same report

Suppose you have a model of a company with several business units. You might want to have a set of financial reports, one for each unit. Or you might want to have (say) revenue for each unit reported on a single P&L, and then consolidated. This article shows you how to do either.

The attached model is set up to show all units (in this case, terminals at a port) on the same report.

two terminal example

To change it to show a separate report for each terminal, open the model in Openbox, and click “Insert” then “Manage arrays” in the Ribbon. Select the “terminals” array and click “edit” (see below).

You should see a window similar to this:

Notice that “Is it a list of alternatives or segments?” is set to “Segments”. This tells Openbox that the items of this array can be combined on a single report, and added up.

In the dropdown, choose “Alternatives” instead. Then click OK as many times as needed to get back to the main Openbox window.

Now press F9 to show the preview. As you will see there are now two P&Ls, one for each terminal.

To go back to a single P&L, go into the window again and change “Alternatives” back to “Segments”.

Merging and duplicating reports

You can create a copy or duplicate of any report by clicking “Duplicate” in the “Insert” section of the Openbox main window.

The duplicate report will have the same line items in it initially, but these can be changed as for any report. Changes won’t affect the original report.

This can be useful if you want, for example, to have a report on several timelines. Just create a duplicate and change the timeline to what you want.

You can also merge one report into another, as follows:

  1.  Select the report you want.
  2. In the Ribbon, click “Insert” then “Merge into”. 
  3. A dropdown of other reports appears. Select the one you want.
  4. All the lines from the report from step 1 will be inserted at the bottom of the report from step 3.
  5. Drag and drop the lines to re-order them as needed 

Scenarios for timeseries inputs

In pretty much any financial model, you want the ability to run several scenarios and compare results. Openbox gives you a scenario manager for free on the InpC sheet, which works for inputs or assumptions that are constants. But what if you want to have scenarios for inputs that change over time? 

Suppose for example your model depends heavily on interest rates. So you want to have interest rate scenarios – let’s say high, medium and low. Interest rates change over time, so you need to have three rows on your input sheet and get your model to pick the right one.

The attached example shows how you can do this sort of thing using arrays. You create an array called something like “interest scenarios”, and put the names of the scenarios in the array. Then make the interest rate input vary by array. Finally, add a calculation that picks the desired interest scenario, based on a new constant input on the InpC sheet. 

example with InpS scenarios

Picking one item from a table using INTERSECT

The INTERSECT function lets you pick one item from a 2 dimensional table (rows and columns). It works much like INDEX(..MATCH…MATCH) in Excel.

The syntax is INTERSECT(<name of item that is a table>, <value to look up down the rows>, <value to look up across columns>)

For example, suppose you have an item which is a table showing the payments made by three people in each month. Call it “Monthly payments”. The people are called Alice, Bob and Charlie.  The item has two arrays: people (containing Alice, Bob and Charlie) and month( January to December).

Now suppose you have an item with the month you want – “Selected month”, with the value “Mar”.

To get the payment that Bob made in March, type INTERSECT([Monthly payments], “Bob”, [Selected month])

Note that the table must be on a table sheet, and you must have “Don’t include tables as ingredients in blocks” selected

See Add an input which is a table for more details.

An example is here: intersect example

Create a weighted average

Suppose you need to create a weighted average in your model. For example, you might have different cost escalation rates for different types of cost, and want to calculate the average cost escalation for your project, based on the proportions of different costs.

The Openbox file at the end of this article shows an example of how to do this. The calculation has an input that is a cost escalation rate (a % for each period) and a weighting factor (a constant %, although you could make it different in each period). Both have an array applied, which is the list of cost types.

You then create a calculation that multiplies the rate by the weighting factor. This will be repeated for each element of the array. Then a final calculation that adds up all the multiplied values to get the weighted average. 

Have a look in the preview for the attached to see how the formulas look in a spreadsheet.


cost weightings example

Checking that calculations are correctly read from Excel into Openbox

This article shows you the basics of reading parts of your existing Excel models into Openbox. But when you have done that, it is important to check that it has been brought into Openbox correctly. There are many different ways that calculations can be done in Excel, and it is not possible to guarantee that Openbox will always correctly convert them.

The first way to check is by running Validation. This will do a number of checks (click here for more detail) on the model which can identify issues with the original Excel as well as issues that have arisen when importing.

This will also create the preview spreadsheet. You can then compare that to the original spreadsheet to see if the results are the same. We strongly recommend you do this whenever importing from Excel.

The second way is to use the “Show in Excel” button in the Ribbon. If you click on an item in the Openbox window, then “Show in Excel”, Openbox will highlight the cell(s) in Excel that correspond to that item in Openbox. You can then compare the original Excel formula, and its Openbox equivalent.

Why has my Openbox menu disappeared from Excel?

Usually you should see the Openbox menu in the Excel Ribbon. However, on occasion it can disappear.

Excel occasionally disables add-ins if it considers they are causing issues with Excel starting up. You can deal with this by going to Excel then clicking : File, Options, Add-ins.

Click on the dropdown menu beside “Manage” and choose “COM Addins”, then click “Go”.

Make sure that “Openboxaddinv2” is ticked, then click OK

If this does not work, repeat the steps above but choose “Disabled items” from the “Manage” list and click “Go”. Make sure Openbox is not listed in the Disabled items. If it is, re-enable it then click OK.

You should then restart Excel.

If these steps do not solve the problem you should try the steps on this page.

check this by , as in the picture below.


However,