Openbox

Add inputs to the model

Adding simple inputs

For inputs which are constants, the easiest way to add them is just to type in the Openbox formula bar. The approach is just like in Excel: press F2 or click in the formula bar, type the input, and then click the tick or press Enter/ Return.


Input sheets

 When looking at the preview, you might have spotted that there’s more than one input sheet.

What do these mean? Well, Openbox lets you separate different types of input. Some people like to have all inputs on a single sheet. And in the open box layout options you can choose that.

But other people like to separate constants, series and table inputs, because those inputs are naturally laid out very differently.

Let’s look at these input sheets. 

First, InpC. This sheet contains only constant items – ones that don’t change over time. It comes with a scenario selector that allows you to specify different values and switch between them. These can be thought of as key levers that you can pull and change the model’s results.

Then, InpS. This is the Series sheet, which is where all inputs that vary over time go. Examples might include number of employees, inflation and so on.

Note that there are two of those sheets. Remember that a model can have two timelines. If you’re modelling the construction and operation of a new road, for example, you might have the construction on a monthly basis and the operations on a quarterly basis.

You might need inputs on a monhtly basis (say, capex for the construction period) and on a quarterly basis (say, number of cars that pay the road toll, per quarter, during operations). It would be confusing to have these on the same sheet,

Finally, there is InpT for table. Often you have a table of data that you want to include in your model, and that doesn’t fit well with series data or constant data. So open box puts it on a separate sheet, which means it’s clearer to see what’s going on.

And crucially. you can edit the inputs in any of these sheets directly – see below.

Adding more complex inputs

OK, so we have seen how to add simple inputs (a constant tax rate or date for example). Now, let’s see how to add some more complex inputs.

Maybe there’s a time series, for example, that we’ve got from the client and we want to put it into the model.

The simplest way to do this is just how you would do it in Excel – copy and paste it in. Let’s suppose we have this Excel file from the client. We select the input data, press copy, then switch to the preview. Select the corresponding cell of the input sheet and press Control V to paste. Done.

Add a new sheet

You can create a new sheet by clicking the ‘add group’ button or pressing Ctrl+G. It will appear beside the “Time” sheet. Double click on the name of the sheet to edit it.

Sheets can be moved around by dragging and dropping them, or by right clicking and selecting “Move”. For more on moving items, see Move things around in the model.

Sheets will appear in the Excel model in the same order as in the Openbox screen.

Add a new section

Select the calculation or calculations you want in the section. You can select several calculations using Ctrl+click, just like selecting several cells in Excel.

Then press Ctrl+Shift+G or click the “New section” button in the Ribbon.

The calculations will be put into a new section. Double click on the name of the new section to edit it.

Sections can be put inside one another, so you can have sections, sub-sections, sub-sub-sections and so on.

If you drag a section out, between two sheets, it becomes a sheet itself. You can also do this by right clicking, selecting “Move” then “(make into sheet)”.

If you drag a sheet inside another sheet or section, it becomes a (sub)-section of that sheet or section.

For more on moving items around in your model, see Move things around in the model 

Move things around in the model

In the main model view, you can see the overall structure, with sheets, sections, and calculations/ inputs within the sections.

This view is good for restructuring the model – moving things around to be where they should be. There are three ways to do this.

First of all, you can drag and drop calculations, sections and even whole sheets. If you move a sheet into another sheet, the first sheet becomes a section. And a section that you move out, becomes a sheet.

Second, you can use arrow keys. Ctrl + up/down/left/right moves an item one step in that direction. When moving sections, Ctrl+Shift+left/right moves them out to become a sheet. When moving sheets, Ctrl+Shift+left/right moves the sheet into the neighbouring sheet as a section.

Thirdly, you can use the right click menu. There is a “Move” menu in the right click menu which shows every sheet and section in the model. This can be handy if you are moving items a long way, and dragging might be slow or awkward.

If you move something by mistake, or to the wrong place, just press Undo (Ctrl+Z).

Add a component/ module to my model

While every financial model is unique, there are standard parts that appear in many models. For example, most financial models will have a fixed asset and depreciation section. Rather than rewriting each section each time, Openbox allows you to save common model parts, or components, and import them into new models. That way, you can focus on the more bespoke parts of the model.

What is a component?

A component is simply part of a model that might be used again in the future. There are two types: a report component and a calculation component.

A report component is just a list of the items that a report should contain, and the order they should be in. It does not say anything about how each item should be calculated.

A calculation component contains formulas, and possibly inputs, but unlike a full model does not have any time settings or reports. You can think of it as a part of a model that calculates something useful. 

Openbox saves calculation components as OBC files, and report components as OBR files, to distinguish them from OBZ files which are full models.

How do I get a component into my model?

Components are just files that can be stored on your PC or in a file sharing system such as Dropbox. You can select them by clicking the “Import Component” button in the Ribbon.

You will then see a window allowing you to select any OBC file on your computer. Note that when you click on one, you will see a preview of it on the right-hand side, as well as a short description written by the person who made the component.  If you move your mouse over the preview, you will see the formulas for each item.

You can also ask Openbox to suggest an appropriate component. Right click on any placeholder and then click “Suggest”. Openbox will look for a component that calculates a result with the same name as the placeholder. For example, if you right click on a “Revenue” placeholder, it will suggest all components that calculate revenue. Just click on the one you want.

Note that suggestions are only for components in your Openbox library. 

Merging

Once you have selected a component, it needs to be connected to the rest of the model. There are two steps to this process.

First, you need to tell Openbox which calculations in the component connect to calculations already in the model. For example, if you’re importing a component to calculate “Revenue“, you want the “Revenue” calculation in the component to replace the “Revenue” placeholder or calculation that’s already in the model.

Openbox will ask you how you want to do this, in the following screen:

This screen allows you to connect the component to the model in any way you like. Openbox suggests, first of all, connecting calculations of the same name. But you can override this, by clicking the dropdown beside any calculation you are importing and selecting another item. In the example above, we’re connecting “Revenue” to “Solar revenue” in the model manually. But Openbox has automatically identified that “Periods per year” needs to be connected.

The two calculations will then be replaced by a single calculation, which is linked to the model and the rest of the component.

If one of these items is a placeholder, there is no more to do here. But sometimes both items have a formula. In this case, Openbox will ask you which formula you want to keep in the merged item, as shown in the example below.

Add a flag, index or discount factor

Openbox makes it easy to add pre-built components to your model, so you can include whole sections with a few clicks. Some parts of financial models are so frequently used that the ability to add them is built into Openbox: flags, indexes and discount rates.

Flags

When you think about the things that models represent, like projects or companies, they typically go through different stages. A project for example will go through a construction period, and then an operational period, with possibly a post-operational/ clean-up period afterwards. Corporate models can have ‘historic’ and ‘forecast’ periods. There can also be key events, such as the drawdown of key debt instruments, or the project’s start of operations, or the date at which a key contract (such as a PPA) ends.

A common way to manage these stages and events is through flags – calculations that give the value 1 at the date of the key event, or during the key period, and zero otherwise. 

Openbox makes it easy to add flags automatically. Click ‘Insert, then the ‘Flags’ dropdown, then ‘<new flag>’.

Openbox will ask you what type of flag you want. There are five basic types:

  1. On a date. A flag that triggers on only one date e.g. a drawdown date or end of life date
  2. Until a specified date. A flag that is active up to a given date e.g. an asset lifetime flag.
  3. After a specified date A flag that activates after some date – e.g. a commissioning date
  4. Between two specified dates. A flag that starts inactive, then activates for a period, then is deactivated – e.g. an asset that is commissioned and then decommissioned
  5. Periodically. A flag that is active once a month, quarter or other period – e.g. a payment period flag

Select the type, enter the relevant dates, name it, and click OK. Openbox then adds a new block of calculations to the model. 

You can then apply that flag to any item by selecting the item, then clicking ‘Insert’ then the ‘Flags’ dropdown again. Click the name of the flag you want to apply. Openbox will modify the item’s formula to include the flag.

Indices and discounting

Models often include indices – factors showing how much a price or payment grows over time, relative to a base value. A typical case would be inflation.

Openbox lets you add indices easily. Click ‘Insert’ then ‘Indexes’, then ‘Add new…’. .

You will be asked for the key dates, and whether you want to calculate the index at the start, beginning or end of the period. Openbox will then insert the necessary calculations.

Discounting works in a similar way.

To apply an index or discount factor, select the item you want to apply it to, then click ‘indexation’ or ‘discount’ and the name of the index or discount factor you want. 

Deal with units marked in red

Openbox checks all units in the model, so it can warn you about formulas which make no sense because they combine inputs in a way that “adds apples and oranges”. For example, there might be two calculations in the model, one in Euros and one in US dollars. These should not be combined without applying an exchange rate.

Units are calculated for each formula, based on the calculations that feed into it. For example, if a calculation takes a number in Euros, and divides it by a number in tonnes, the result must have units of “Euros per tonne”. Openbox will warn you if this is not the case by highlighting the units in red.

The first thing to do if the units are shown in red is to check that the calculation does make sense. For instance, have you applied all necessary conversion factors and exchange rates?

You have three options for fixing units in red:

  • Correct the units, if you decide they are wrong
  • Tell Openbox to try and correct them itself by clicking the units text, then clicking “Use expected”
  • Tell Openbox to stop flagging this unit as wrong. Click the units text and then tick the “Ignore issues” box, then click “OK”.

You can also simply ignore the red text. It will not stop the model being built, but it should be treated as a warning, so we do not recommend this approach.

Change the units for calculations

Each box on the diagram shows the units of that item, centred in the lower half of the box. While units are optional, they are highly recommended because they are another way of avoiding model errors. They allow Openbox to warn you about equations which make no sense because they combine inputs in a way that “adds apples and oranges”. For example, there might be two calculations in the model, one in Euros and one in US dollars. These should not be combined without applying an exchange rate.

Units are calculated for each formula, based on the calculations that feed into it. For example, if a calculation takes a number in Euros, and divides it by a number in tonnes, the result must have units of “Euros per tonne”. Openbox will warn you if this is not the case by highlighting the units in red.

Move your mouse over the units text to see a description of what the problem is. In this case, it would be something like “Expected units are EUR per tonne, but actual units are EUR”.

If you double click on red units text, Openbox will bring up a list of possible units.


You can also click “Use expected” at this point to have Openbox set them automatically to the correct value.

This is not a complete guarantee that a formula will be correct – there are other types of error that can occur. But it does prevent many common ones.

Setting the units for one calculation

To set units, just click the units text on each item, or press Ctrl+Shift+U. You can use any text values you wish for units, or pick one from the list of those already in the model.

Conversely, if you prefer not to enter the units yourself, you can ask Openbox to work them out for you using the ‘Auto Units’ menu. Just set the units for all inputs, and then press the ‘Units – Auto Units’ menu. Openbox will set the units for everything that it can.

Default units

Each model has a ‘default’ unit, which will be applied to all new calculations when they are created. Usually, this is the currency of the model. 

You can also apply the default unit to any calculations in the model that do not have units, or just to the selected calculations. Click ‘Units’, then ‘Apply Default to Selection’ or ‘Apply Default to Entire Model’.

Managing units

Often you want to review all the units in a model and change, merge or delete them. To do this, click ‘Units’ then ‘Manage units’.

You will see a list of all the units used in the model (except a few built-in units such as ‘%’). The default unit will be highlighted in bold.

You can rename any unit by clicking on it and editing the name. This will be applied everywhere in the model that that unit is used. Note that you can change the name to the same name as an existing unit and this will effectively merge those units. If you have, for example, USD 000s and USD000s in your model, and you want to standardise on USD 000s, change the USD000s unit name to USD 000s.

You can also delete units by ticking them and pressing the ‘Delete’ button. Any calculations with those units will now have their units set to ‘<none>’.

Finally, you can change the model default unit by ticking it and pressing the ‘Default’ button.

Create an Excel model from your Openbox model

Click “Spreadsheet” then “Build model”, or press Ctrl+Shift+F9

Openbox will then create an Excel model that does the same calculations as the model you have just created. Depending on the size of the model to be created, this may take a few seconds or several minutes.

During the process, it will run the standard validation checks, and you may see one or more warning windows. For more on validation, see this page: What checks does Openbox do as part of validation?.

You will also be asked for a filename for the Excel model. By default, Openbox puts it beside the Openbox OBZ file, and gives it the same name, just with a different extension (e.g. xlsb). But you can change that if you wish.

Once the model has been created in Excel, it is a completely standard Excel model, with standard formulas. It can be shared, modified, and used just like an Excel model created by hand. There is no need for anyone except the person who created it to have Openbox.

You can change the type of model that is created (xlsx/ xlsm/ xlsb) by clicking “Help and settings” then “Openbox settings” in the Openbox window.

Select the file format you want from the dropdown, then click “OK”.

Repeat calculations using arrays

You often want to repeat a set of calculations in your model. Here are some examples:

  • You might have several different products and need to calculate revenue by product and total revenue;
  • You have several scenarios, and you want to take the minimum and maximum value of some metric (e.g. IRR) over all scenarios;
  • You have three main types of asset: buildings, office equipment and other. Each type of asset has a different lifetime, and the purchase/ disposal profile will be different. You need to track capex, depreciation and disposals for each asset type, but report the total on your balance sheet.

Openbox allows you to do this easily.

It’s a two step process. First, write the calculations as if there was only one product/ scenario/ asset class. Then tell Openbox that some of the inputs need to be repeated for all items in an ‘array’ that you define. An array is just a list e.g. “buildings, equipment,other” or “upside, base case, downside”. Openbox will repeat the inputs, and any calculations that depend on those inputs, directly or indirectly. So if you tell Openbox that the input “asset life” varies by type of asset, essentially all the fixed assets section will be repeated three times.

You might be wondering at this point how we stop the model becoming very large. Later in this article we’ll see how to consolidate calculations so that not everything in the model is repeated. But first, let’s look at how to create an array.

How to create an array

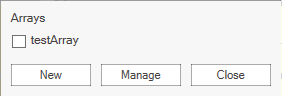
To create an array, click “Manage Arrays” in the Ribbon. You can then add a new array, or edit or delete an existing one.

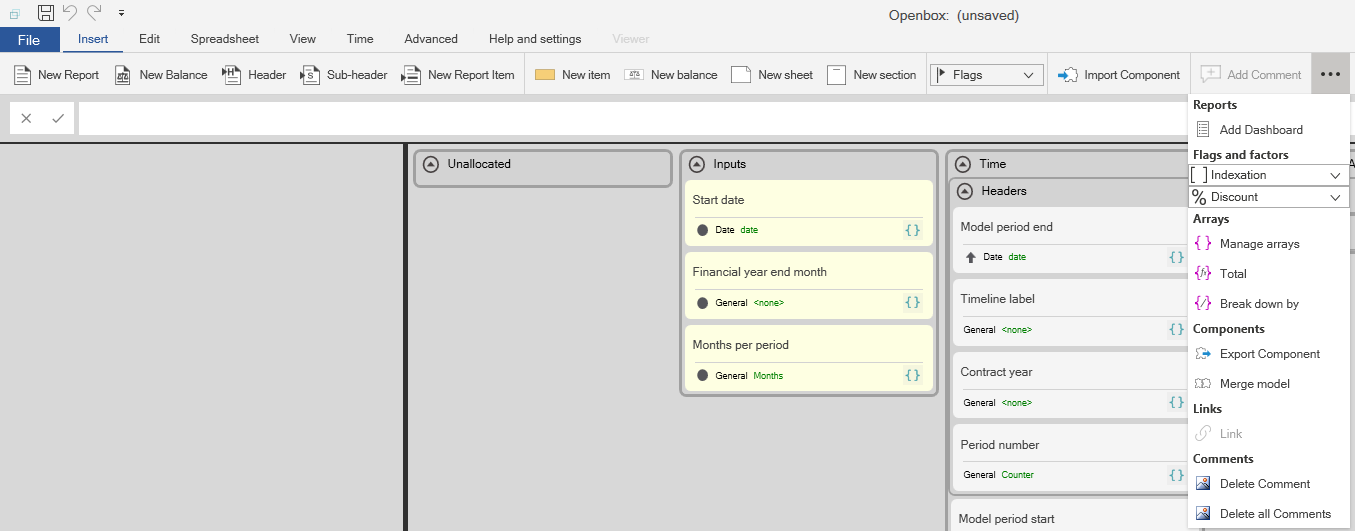
To apply an array to an input, select the input on the diagram and then click the ‘{ }’ icon on it. This will ask you if you want to add a new array to the item, or to manage the existing arrays.

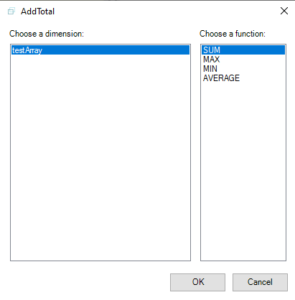
If you click “New”, you’ll see a window like the one below.

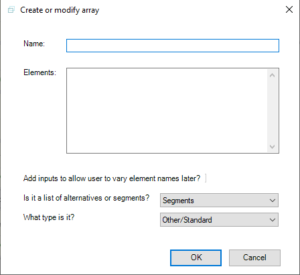
To create a new array, you need to tell Openbox a few things about it:

  • Its name. This can be any text
  • The elements. This can be a list of text items (e.g. ‘high case’, ‘central case’,’ downside case’) or a series of numbers (e.g. 1:10 represents all the numbers from 1 to 10 inclusive) or dates.
  • Whether the elements are numbers, dates or just text (“standard”).
  • Whether the elements of the array are ‘alternatives’ or ‘segments’. This affects how they will be shown on reports.

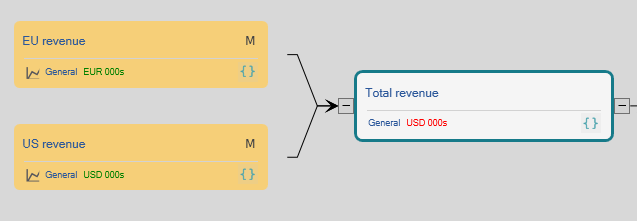
Let’s explain a little more about alternatives and segments. “‘Alternatives” means that the elements are different possible values for the input, but that it does not make sense to add them together. “Segments” means that it does make sense to add them together. For example, a list of scenarios would be alternatives, whereas a list of products would be segments. This is because you could sensibly add together say the revenue for each product to get total revenue but adding together the revenue for each scenario wouldn’t make sense. 

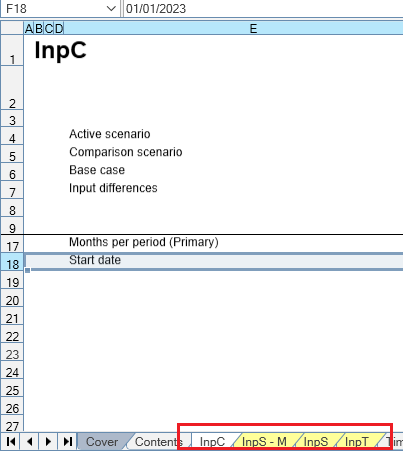
Openbox will put all segments on the same report, but will create a separate report for each alternative. So if you have three scenarios (“alternatives”) for say revenue, which appears on the income statement, you get three income statements. But if you have revenue for three business units, which are alternatives, you get the revenue for all three units on the same income statement.

Once you click ‘OK’, Openbox will add the array to the dropdown list. The selected input, and any calculations that depend on it, will now have multiple values, one for each item in the array.

You can add the array to other inputs by selecting the input, clicking the ‘{ }’ and then ticking or unticking the arrays you want to apply.

And once you have added arrays to inputs, that is it. Remember that Openbox automatically works out which other calculations need to vary. For example, if “Asset lifetime” varies by the “Asset class” array, then “Depreciation”, “Net book value” and so on will need to vary too.

This can become complex. Openbox will check and warn, during validation, if it finds any array inconsistencies. In particular, if a balance varies by some array, all the flows into it need to vary by that array too. To give an example, suppose you had three business units and wanted “Cash” to be tracked separately for each one – to vary by business unit. And suppose it is calculated as opening cash plus net cashflow. Then net cash flow would have to be specific to the business unit too – it would have to vary by business unit.

Multiple arrays

You can also combine several arrays in one variable. For example, you might want to split “Revenue” by product, but also by geography, so you can look at US sales of product 1, European sales of product 2 and so on.

To do this, create a “Product” array, say “Product1,Product2,Product3″, and a “Geography” array, say “US,Europe,Asia”. Click on the desired input, “Sales forecast” say, and then ‘{ }’. Make sure both “Product” and “Geography” are ticked.

Now the “Revenue” item will have 3 x 3 = 9 values, one for each possible combination of product and geography. Any items that depend on it will automatically have nine values as well, unless you deliberately ‘consolidate’ an array (see below).

Note that using multiple arrays can quickly lead to a very large number of calculations – use caution!

Consolidating values across an array

Often when you have scenarios or arrays, you want to combine or compare the values in some way. You might want to sum revenue by product line to get total revenue, or to look at the minimum NPV achieved across all scenarios.

To do this, use the special functions SUMOVER, MAXOVER, MINOVER and MEANOVER. The first argument is the array you want to take the sum, max, min or average over. The second argument is the variable you are summing/ maxing/ mining. For example “SUMOVER([revenue by product], “product”)” is the total revenue across all product lines.

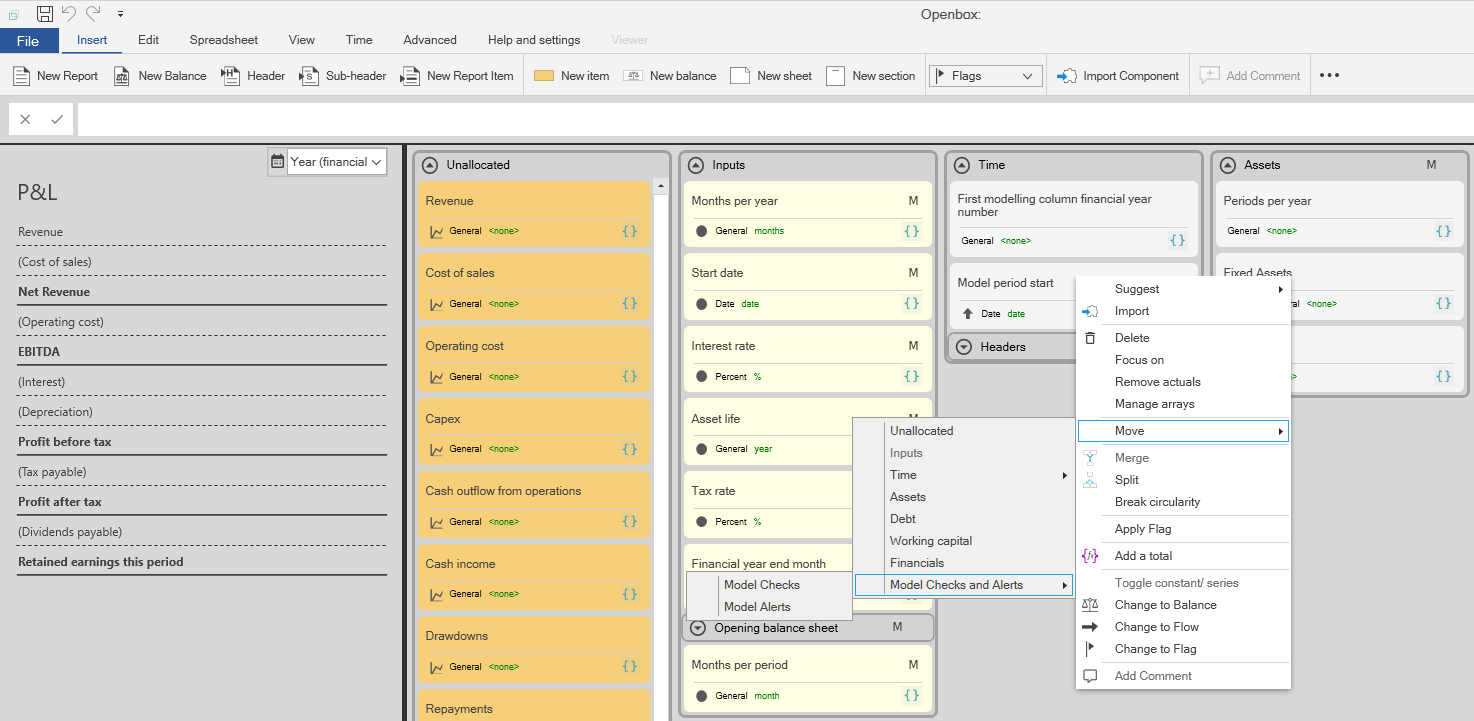
The easiest way to do this is to select the item you want to consolidate, and then click “Insert”, three dots for the advanced menu, then the “Total” button . This will ask you how you want to consolidate, and then will add a new calculation block that does the consolidation.

You can also go the other way by clicking the “Break down by” button, which is beside the Totals button. This takes an existing calculation and allows you to make it vary by array. Here’s how it works:

  1. Select the calculation. For example, select “Fixed assets
  2. Click “Break down by
  3. Select the array you want to break down by.
  4. You’ll be asked how you want to consolidate the array – usually, by SUMming.
  5. Openbox will then work out what the inputs are that affect “Fixed assets”. At least one of them must vary by the array you specified in step 3, if Fixed Assets is to vary by that array. Tick the input(s) that vary by this array and click OK.
  6. Openbox modifies the inputs as specified. It also adds a new calculation that works out Fixed Assets for each member of the array you chose, and sets “Fixed Assets” to be the consolidation of those items.
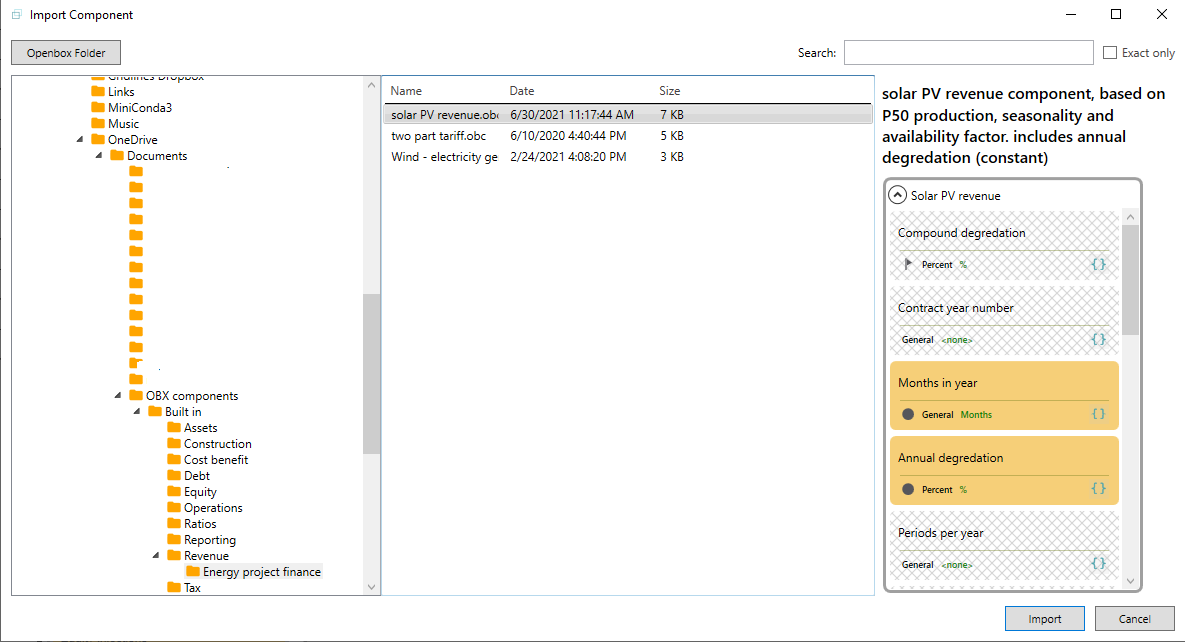
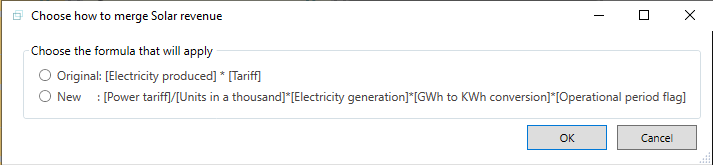
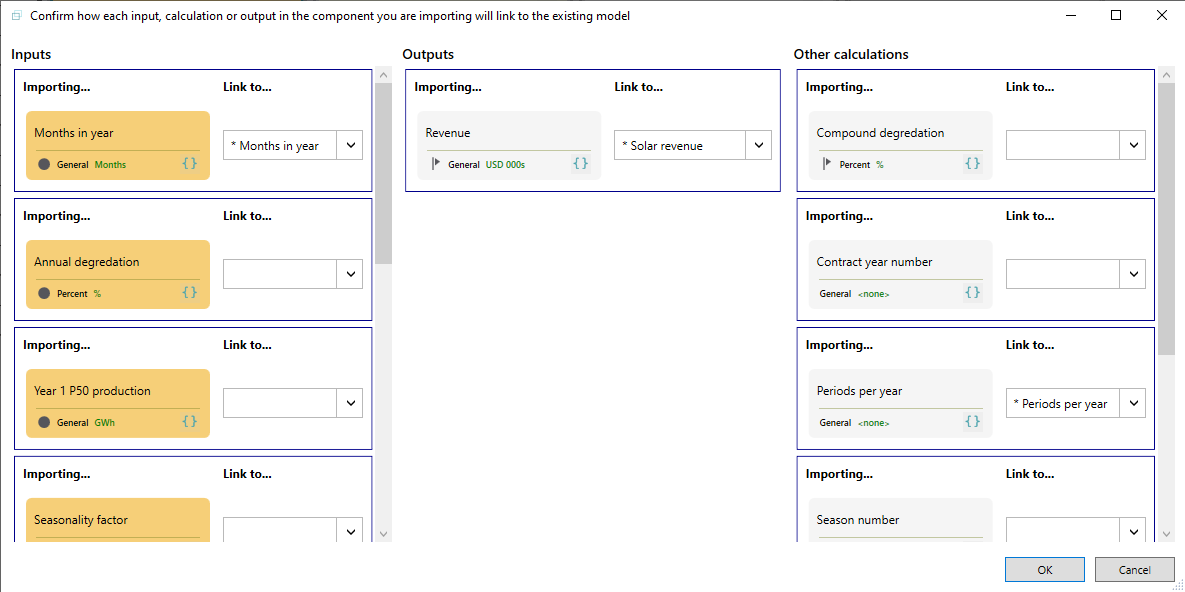