Set the model timeline(s)
Unlike an Excel model, where the time basis is built in through the column structure, formulas and headings, time is effectively an input to an Openbox model. So you can easily change it part way through model development.
An Openbox model can have several timelines: a primary timeline, a secondary one, and separate one(s) for each report. Here’s how that works.
All models have a primary or main time axis. This spans the whole period that the model covers. Each model can also – but doesn’t have to– have a secondary time axis. This secondary axis is more detailed than the first and applies to only part of the period covered by the model.
Let’s take an example. You want a model for a new power plant. The model needs to start on 1 January 2025 and run to 31 December 2049. Most of the model will be on a quarterly basis. Construction, which is due to start in 2025 and take 12 months, needs to be modelled on a monthly basis, however. So, you tell Openbox that the primary time axis is quarterly, from 1 January 2025 to 31 December 2049, and that the secondary axis is monthly, from 1 January 2025 to 31 December 2021. All calculations for construction will be done on a monthly basis, and the results converted automatically (using standard Excel formulas) to a quarterly basis, so they can feed into the main quarterly part of the model.
This is separate to the time axis for any reports. Each report can be on any time axis (as long as it is no more detailed than the primary axis). This means that you can have yearly reporting (on calendar, model or financial year basis) in a model with a monthly construction period and quarterly operational period, and Openbox will handle all the month to quarter to annual conversions for you. Or you can have one report on an annual basis, one on a quarterly basis and so on.
You can also tell Openbox that you want to see multiple report timelines. Suppose you have a quarterly model, and your client wants to see reports on a semi-annual and annual basis. Create the report, set the time axis to “Yearly” and then tick the “Add reports for all timelines” box on the “Layout” options tab. When you create the preview spreadsheet again you will see quarterly, semi annual and annual versions of the same report.
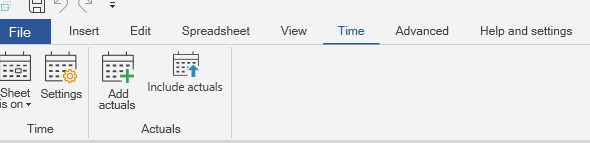
Settings menu
You tell Openbox what the timelines are through ‘Time’, ‘Settings’ in the menu bar.
When you click on settings, you will see the main time settings window, as shown below.
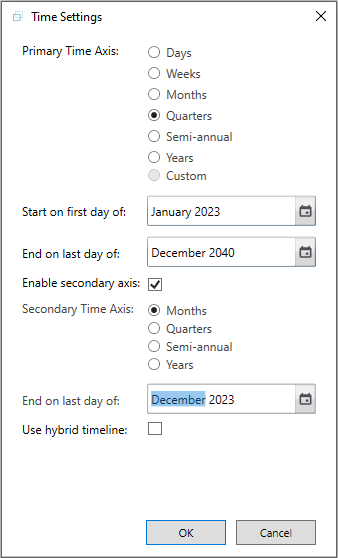
Parts of the settings window
In the dialog box above, the top part sets the primary time axis. You must set this for any model. A time axis has a start date, an end date, and a periodicity (e.g. quarterly) within that. The only restriction here is that the end date must be a whole number of time periods after the start date. For example, you can’t have a quarterly model that starts in January and finishes in May.
If you want a secondary axis, tick the ‘Enable secondary axis’ box. You can then choose the start date, end date and periodicity of the secondary axis on the right-hand side.
There are some restrictions on the secondary axis. You can think of the secondary axis as like ‘zooming in’ on part of the period covered by the model, and the restrictions reflect that.
First, it must be more detailed than the primary. You can have a monthly secondary axis in a model with an annual primary axis, but not the other way round.
Second, the dates for the secondary axis must also be within the dates for the primary axis. The start date is automatically the same as the start date for the primary axis, and the end date must be on or before the end date for the primary axis. You cannot ‘zoom in’ on a time period that is not actually part of the period covered by the model.
Note that the end date must be the end date of one of the periods of the primary axis. This avoids complex formulas for taking values from the secondary axis part of the model and transferring them to the primary part.
Finally, please note that the secondary timeline option is not available when the primary timeline is days or weeks. This is because of the complexity of converting from (say) weeks to years. We expect to offer this in a future update.
Hybrid timelines
You might have spotted that there’s a “Use hybrid timeline” box in the settings window.
By default, Openbox creates separate worksheets for primary and secondary calculations and inputs. So if you have a quarterly primary axis and a monthly secondary axis, then some sheets will have quarterly dates across the top, and some will have monthly. But they won’t have both.
A “hybrid” timeline includes both timelines on the same sheet. So in our example, the dates would start as monthly, and change to quarterly after the secondary time axis finished.
This only affects how the model is laid out – it does not affect the results – and so is purely personal (or client) preference.
Timeline for reports
Good practice is that the model should calculate on the most granular or detailed basis required, and then this should be consolidated into reports, which might be on a less detailed basis. When setting the time in this dialog box, always choose the most granular time basis that the model will need. You can change the time basis of reports later – it is easy to have a model that calculates monthly, but which produces semi-annual or annual reports.
To change the timeline of a report, select the report in the reports window, on the left, and click the time dropdown at the top right of the report.
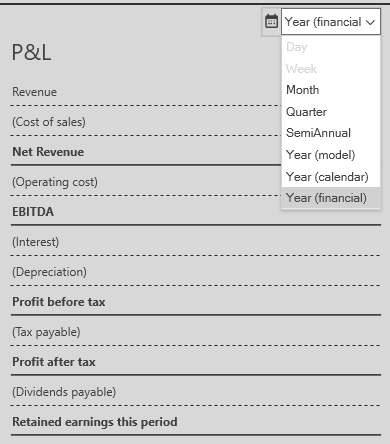
Note that day and week are greyed out, because reports cannot be on a more detailed timeline than the main model.