Displaying scenarios on charts
You can display charts in the Openbox view by clicking the chart icon at the bottom right of each line item, or by pressing F11.
By default, this only displays one line – the base case. But if you are using the “Constants/ Scenarios” layout option for Inputs (that is, you have InpC and InpS sheets), you can display several scenarios at once.
In the “View” menu, click “Scenarios”.
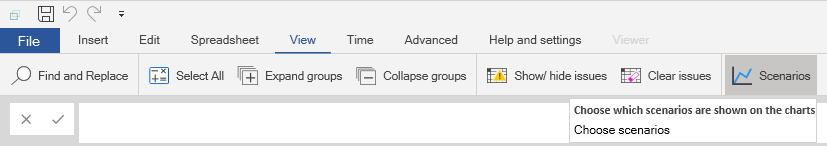
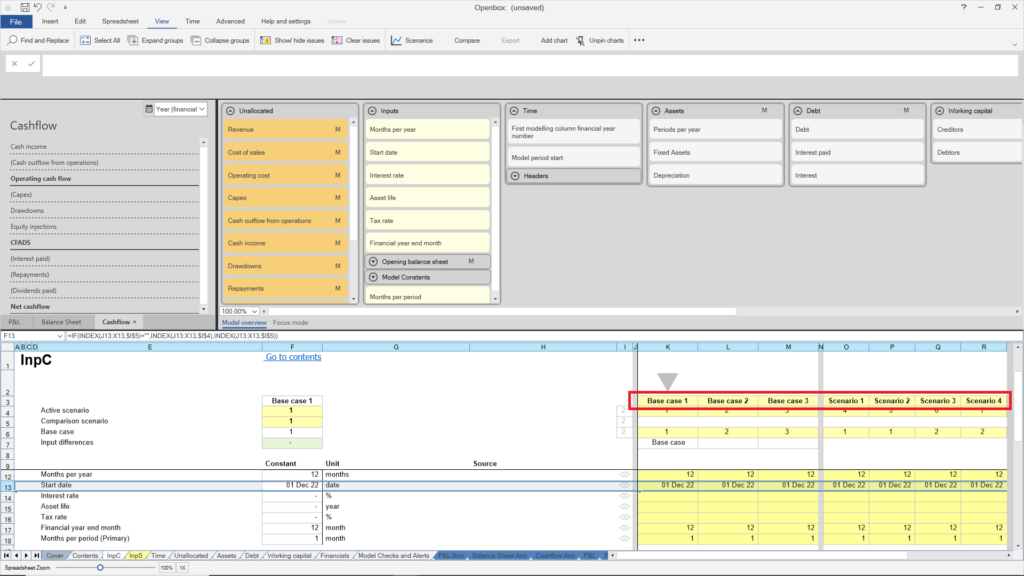
Openbox will show you a list of the scenarios on the InpC sheet. Check the ones you want and click OK. The scenarios are those highlighted in the red box in the picture below.
Openbox will ask you if you want to rerun the model. Click “Yes”. It will then calculate the results for all selected scenarios in the background and display them on any charts you display.
You can also compare two scenarios – for example, budget and forecast. Just click the “Compare” button beside scenarios, and choose the ones you want.